Karst (Under Construction)#
[text here]
Introduction#
Methods#
2.1 Collating Ground-Based GWR Estimates#
Ground-based GWR estimates from hundreds of published studies and databases were compiled into a single global dataset. Each estimate was:
Mapped to a 0.5° × 0.5° grid cell (same as WaterGAP resolution).
Standardized in units and reference period to ensure comparability.
Filtered to remove duplicates, outliers, and short-term measurements.
The result is a harmonized benchmark dataset of grid-cell GWR used for tuning and validation.
2.2 Simulating GWR With WaterGAP 2.2e#
Overview#
WaterGAP partitions effective precipitation into runoff components and then computes diffuse groundwater recharge (GWR) as a capped fraction of one component.
Step 1 — Partition Effective Precipitation#
Urban runoff R₁: 50% of effective precipitation on urban land is direct runoff.
Soil overflow R₂: Excess water when soil storage exceeds capacity.
Nonlinear runoff R₃ (Eq. 1):
where \({S}_{s}\) is current soil water storage, \({S}_{s,max}\) its maximum capacity, and \({\gamma}\) a calibrated exponent.
Step 2 — Compute Diffuse Recharge (Eqs. 2 & 3)#
\(R_g = \min(R_{g,\max}, f_g \cdot R_3)\)
where (f_g) is the product of four modifiers:
\(f_g = f_r \cdot f_t \cdot f_h \cdot f_{pg}\)
f_r: relief/slope factor
f_t: soil texture factor
f_h: hydrogeology factor
f_pg: permafrost/glacier factor
Daily maximum recharge (R_{g,max}) is capped by soil type (coarse: 7 mm/d, medium: 4.5 mm/d, fine: 2.5 mm/d).
Step 3 — Groundwater Storage#
Recharge is added to a groundwater store and released to rivers as baseflow:
\(Q_{gw \to sw} = k \cdot S_{gw}\)
where \({k}\) is the groundwater discharge coefficient and \({S}_{gw}\) groundwater storage.
2.3 Simulating GWR in Karst#
Localization of Karst Areas#
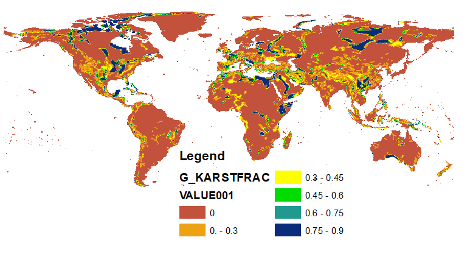
Karst is identified using the World Karst Aquifer Map (WOKAM). The karst fraction of each grid cell is computed as (Eq. 4):
[ f_{text{karst}} = min left(f_{k,max}, frac{sum_i text{Share}_i A_{text{overlay},i}}{A_{text{cont}}}right) ]
where shares are 0.4 for discontinuous and 0.9 for continuous/mixed categories, capped at (f_{k,max}=0.9).
Karst GWR Calculation#
For karst cells, recharge is simply:
[ R_{g,text{karst}} = R_3 ]
Combine Karst and Non-Karst Recharge (Eq. 8)#
[ R_{g,text{grid}} = frac{f_{text{karst,land}}}{f_{text{land}}} R_{g,text{karst}} + left(1 - frac{f_{text{karst,land}}}{f_{text{land}}}right) R_g ]
This weights karst recharge and diffuse recharge by their respective land fractions.
2.4 Modifying the Computation of GWR Outside of Karst Areas#
Data Updates#
Relief factor: recalculated using modern global DEMs.
Soil factor: updated from Harmonized World Soil Database.
Revised Recharge Cap (Eq. 7)#
[ R_{g,max} = begin{cases} 7.0 & text{coarse soils} \ 4.5 & text{medium soils} \ 2.5 & text{fine soils} end{cases} ]
Recharge in semi-arid coarse soils is only generated when precipitation exceeds 12.5 mm/d.
Regional Adjustments#
Removed Mississippi Embayment correction (no longer needed).
Removed Bangladesh wetland mask (allowed recharge).
Calibration#
Parameters (f_r, f_t) were tuned against the global GWR dataset, minimizing bias and RMSE while preserving streamflow match.
2.5 Parameter Tuning Procedure#
A global optimization approach was applied:
Run baseline simulation with initial parameters.
Compute error between simulated and observed GWR.
Adjust (f_r, f_t, f_h, f_{pg}, k) within plausible ranges.
Re-simulate, recalculate error, iterate until convergence.
Performance was measured using RMSE, bias, and fit to streamflow signatures.
2.6 Validation#
After tuning, model results were validated against:
Independent GWR data not used in calibration.
Streamflow observations from GRDC stations.
This ensured that improved recharge estimation did not degrade river discharge performance.
2.7 Impact Analysis#
Finally, the impact of the methodological improvements was analyzed:
Global mean GWR: compared to previous WaterGAP versions.
Spatial distribution: mapped to assess regional differences.
Contribution of karst: quantified as percentage of global recharge.
Streamflow fit: checked to ensure good agreement with observed hydrographs.
Karst .. _tutorial_karst:
Run ReWaterGAP with Karst (Under Construction)#
This tutorial introduces the modifications in ReWaterGAP for handling karst regions and explains the required input files, as well as the assessment methods.
Introduction#
[Insert Introduction here]
Implemented Modifications#
The following extensions and changes need to be made to the code:
Fraction of karstification#
A fraction of the continental area is defined as karst. For this fraction, the runoff component (R3) is treated as groundwater recharge.
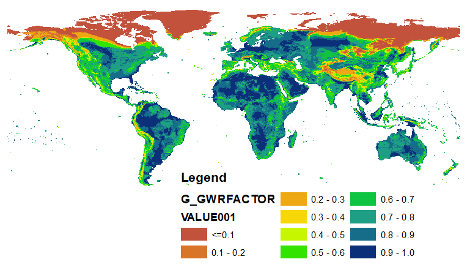
Groundwater recharge factor (fg)#
The original calculation of fg has to be replaced by an externally provided input factor.
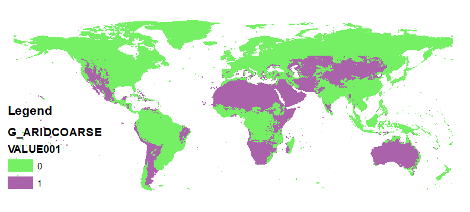
Semi-arid coarse-texture adjustment#
A grid-cell-specific indicator allows special handling of (semi-)arid regions. If a semi-arid grid cell has R<sub>gmax</sub> > 5 mm/d (indicating coarse texture), groundwater recharge occurs only when precipitation exceeds 12.5 mm/d (instead of being triggered solely by coarse texture).
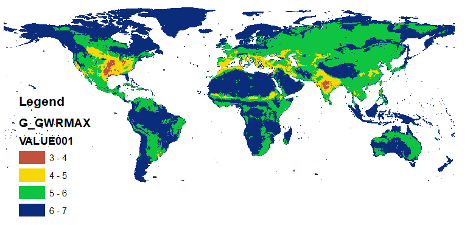
Maximum groundwater recharge dataset#
A dataset specifying the maximum possible groundwater recharge rate (mm/d) needs to be implemented
Input Files#
ReWaterGAP requires additional input files for the karst extensions:
G_ARIDCOARSE.UNF2#
The input file for indicating coarse arid gird cells
Value: 1
Unit: [-]
G_GWRFACTOR.UNF0#
The input file for groundwater recharge factor
Range: 0 – 1
Unit: [-]
G_KARSTFRAC.UNF0#
The input file for karst fraction
Range: 0 – 0.9
Unit: [-]
G_GWRMAX.UNF2#
Specifies the maximum groundwater recharge rate.
The input file for gwr max
Range: 3 – 7
Unit: [mm/d]
Assessments#
To evaluate the impact of the modifications, the following assessments are recommended:
Water balance#
Streamflow evaluation#
Validate model outputs against observed streamflow