Run WaterGap for a specific basin#
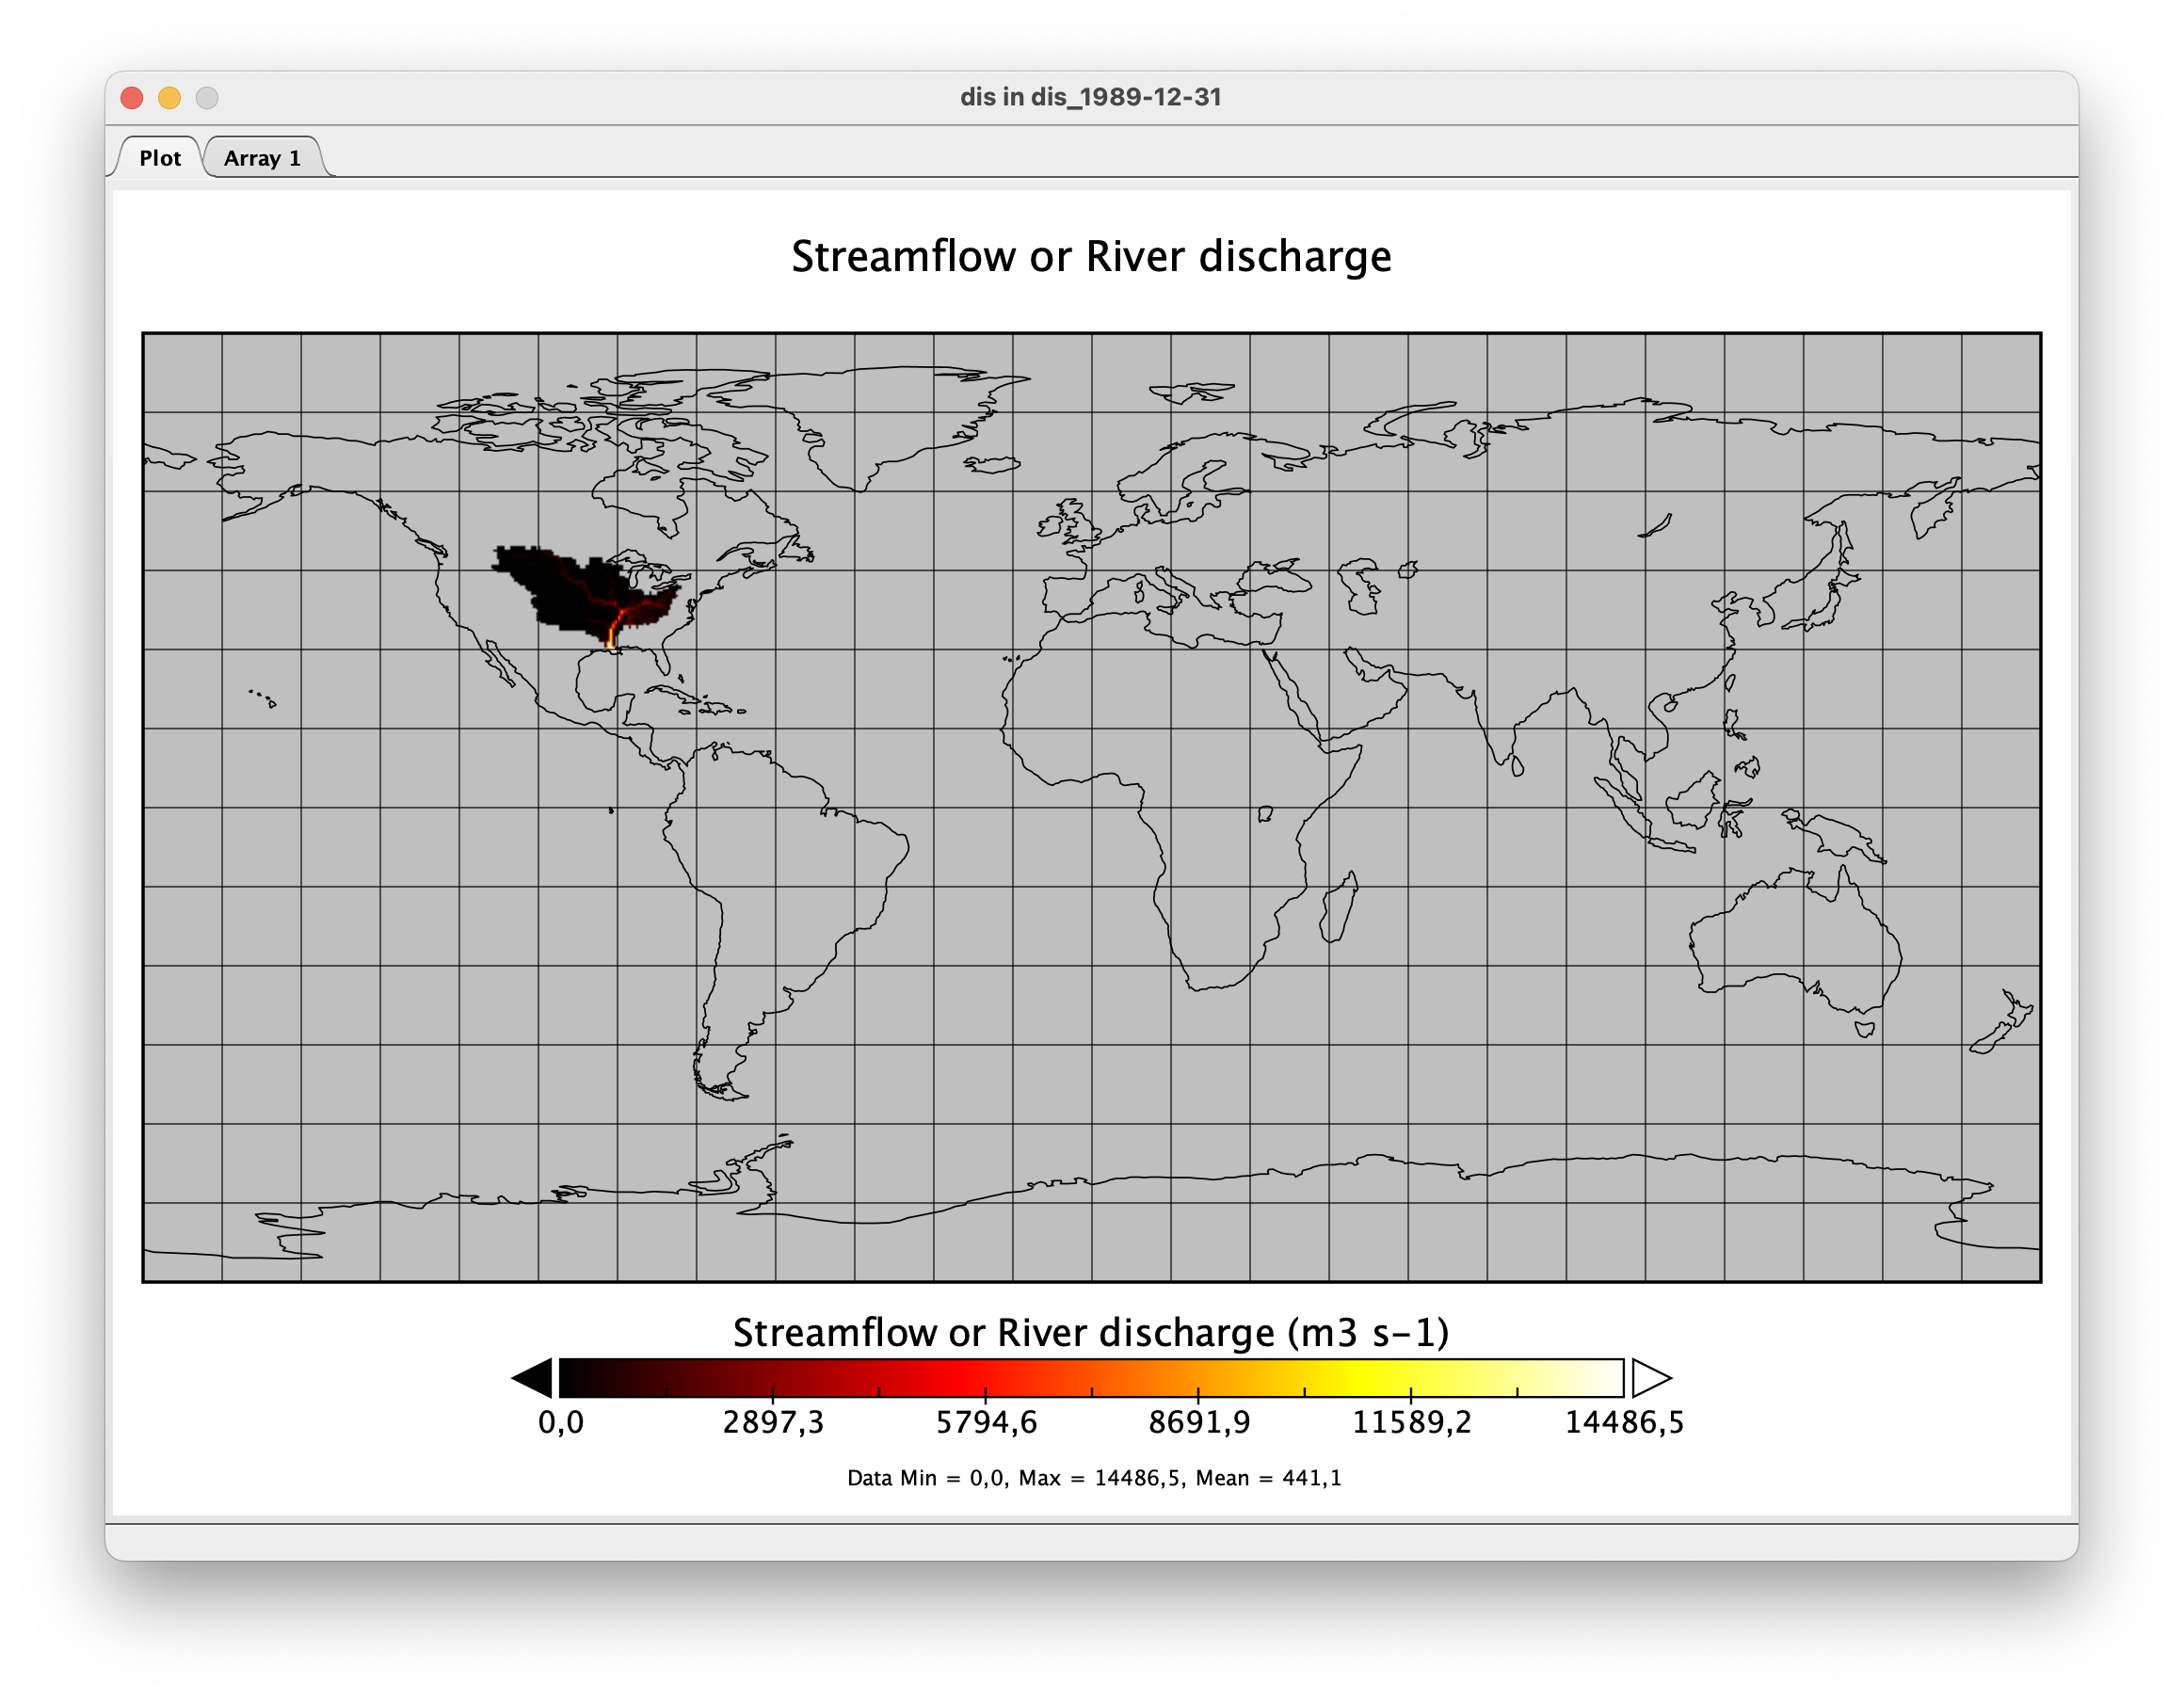
In the example below, we will run WaterGap with a standard run configuration for one year (1989) for the Mississippi basin.
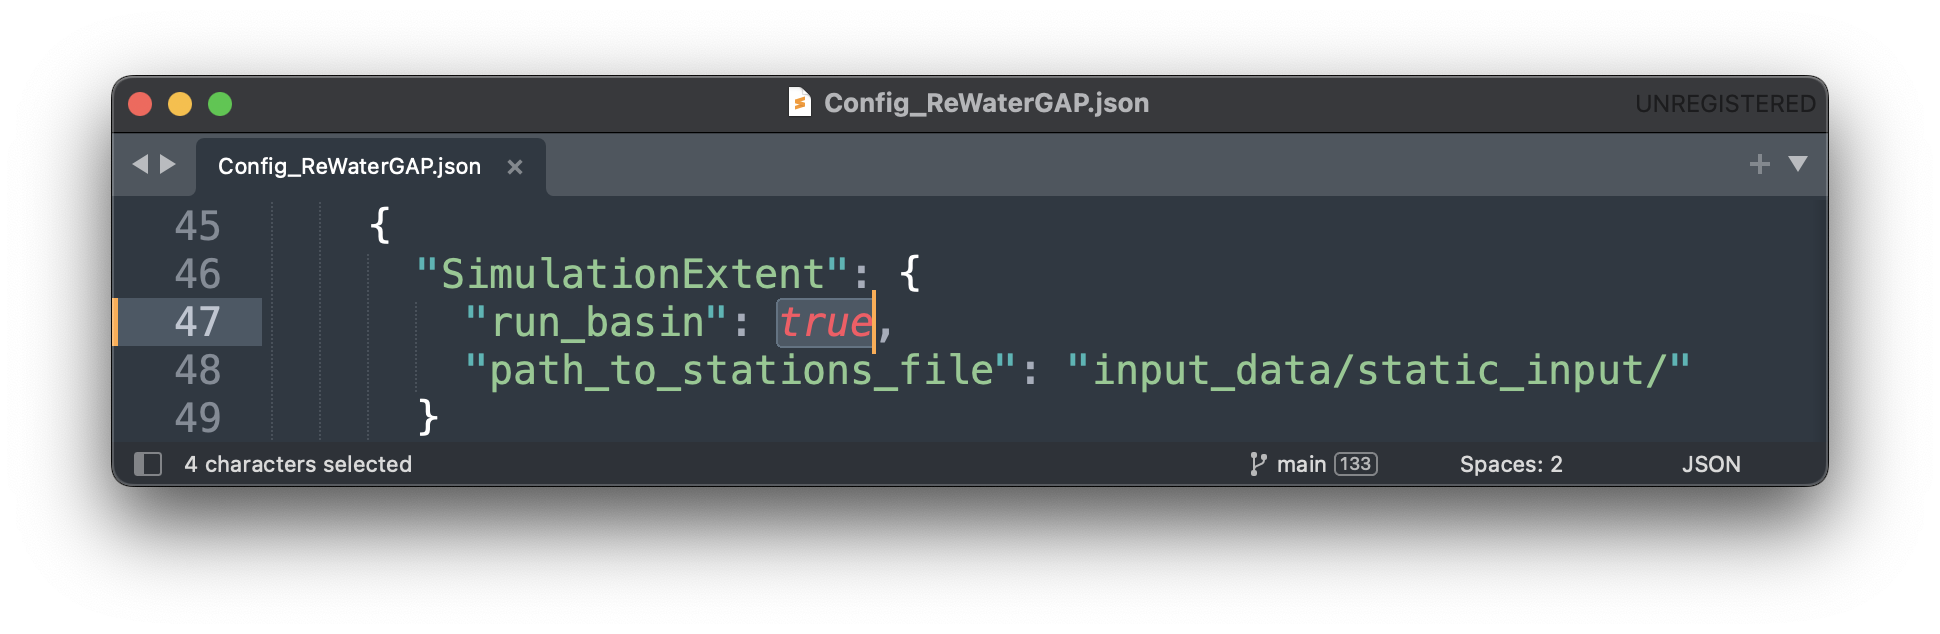
Follow the standard run instructions for preparring the input data and setting up the configuration file from steps 2.1 through 2.5 here. Then, as an additional step set the “SimulationExtend” under “run_basin” to “true” in the configuration file.
We will only write out the “streamflow” variable. Under “LateralWaterBalanceFluxes” find “streamflow” and set it to “true”. Everything else should be set to “false”. For a detailed explanation on which variables can be written out see the glossary. Then save the configuration file.
If “run_basin” is set to “true” you need to modify a station.csv. By default, the stations.csv file is located under “input_data/static_input/”. This path can be changed in the configuration file under “path_to_stations_file”.
Define the basin in the stations.csv file basesd on the latitude and longitude coordinates of the downstream cells. Watergap automatically computes corresponding upstream cells, for the downstream cells you manually specified. The latitude and longitude that define the Mississippi basin are given in the “mississippi_basin.csv” found in under “/ReWaterGAP/misc/mississippi_basin.csv”. Copy the latitude and longitude values from the Mississippi file into the stations.csv file (located here: “/ReWaterGAP/input_data/static_input/stations.csv”). Make sure the contents of the latitude and longitude of the stations.csv file are emptied when copying values into it.
Lastly, run the command below to start WaterGAP:
$ python3 run_watergap.py Config_ReWaterGAP.json
Visualize your results#
To visualize the output of any given simulation we suggest using Panopoly. For more detals see here.
For the year 1989-01-01 and the Mississippi basin the result should look like this: